CipherPrint: Utilizing Machine Learning and Optimal Hashing to develop unique device fingerprints
Enhancing Device Fingerprinting by Leveraging Optimal Hashing Algorithms and Machine Learning Techniques on CPU Timing Values

Abstract:
In the era of digital interconnectedness, device fingerprinting has emerged as a crucial technique for enhancing cybersecurity and personalizing user experiences. This project investigates the feasibility of creating unique device fingerprints based on a dataset containing operation output data from various platforms, including Win32, Linux armv7l, iPad, and iPhone. Our primary objectives are to determine whether the dataset can be used to accurately predict key features such as the device platform and the specific processor used. Additionally, we aim to identify the most effective hashing algorithms for developing robust fingerprints using the comprehensive component data set present for each entry, beyond just CPU timing values. The study explores various methodologies, including time-based fingerprinting and machine learning models, to achieve these objectives [1] [2]. Time-based device fingerprinting leverages differences in clock signals and computation times to uniquely identify devices [3]. We also examine the potential of machine learning algorithms, such as Random Forest, K-Nearest Neighbors (K-NN) and XG Boost [2]. Through this research, we seek to contribute to the field of device fingerprinting by providing insights into the most effective techniques and algorithms for accurately identifying devices and their attributes, ultimately enhancing network security and user identification processes.
A. Introduction and Previous Work:
Device fingerprinting techniques have evolved over the years. Traditional methods often relied on static attributes such as IP addresses, user-agent strings, and installed plugins [1]. However, these methods are increasingly vulnerable to spoofing and other countermeasures. Time-based device fingerprinting, which leverages the unique timing characteristics of a device’s CPU, has shown promise in overcoming some of these limitations.
By measuring the time it takes for a device to complete specific computations, we can capture subtle variations that are difficult to replicate or obscure. This approach, exemplified by tools such as CryptoFP, demonstrates the potential for creating robust, dynamic fingerprints that remain effective even in the face of sophisticated evasion tactics [3]. In addition to time-based techniques, machine learning has become a powerful tool in the field of device identification. Machine learning models can analyze large datasets to uncover patterns and relationships that are not immediately apparent. For example, previous research has shown that attributes such as time to live (TTL) and fragment identification number (IPID) can be used to distinguish between different operating systems [2].
By applying machine learning algorithms to our dataset, we aim to identify the features and patterns that best differentiate device platforms and browsers. Another critical aspect of our project is the evaluation of different hashing algorithms for generating unique device fingerprints. Hashing algorithms transform data into a fixed-size string of characters, which ideally is unique for different inputs. Common hashing algorithms include MD5, SHA-1, and SHA-256. Each 1 algorithm has its strengths and weaknesses in terms of speed, collision resistance, and security. By analyzing the components field in our dataset, we can assess the performance of these algorithms in creating distinct, reliable fingerprints.
Our project is structured around two main objectives: device platform identification, and optimal hashing techniques. For device platform identification, we will analyze the operation data, focusing on CPU timing values, to classify devices accurately. We will employ machine learning models such as Random Forest, K-NN, and XG Boost to train and evaluate our classifiers [2]. Also, we will compare various hashing algorithms to determine which is most effective for generating unique device fingerprints using only the device config.
B. Proposed Approach
To evaluate the effectiveness of the given dataset (collected from the Department of Electrical and Computer Engineering, UC Davis) [5], including the CPU timing values, we conducted several experiments to address the following questions:
- Can we accurately determine the device platform?
- Which specific processor was used to send the request?
- Are there specific hashing algorithms which are best suited to develop fingerprints?

B.1. Device Platform Identification:
To identify the device platform, we will analyze the operation data, specifically the CPU timing values. By using machine learning models, we aim to uncover patterns and relationships that can accurately classify the platform of the device. The process involves:
- Data Pre-processing: Extracting relevant features from the operation data.
- Feature Engineering: Enhancing the dataset with additional attributes that may improve model performance. This also includes doing feature selection to then reduce the number of relevant features. This process can help remove any noise that we are seeing in the training process [6].
- Model Training: Using classification algorithms such as Random Forest [7], K Nearest Neighbours [8], and XG Boost [9] to train models on the pre-processed data.
- Model Evaluation: Assessing the accuracy and robustness of the models using cross-validation and performance metrics such as accuracy, precision, recall, and F1-score [10].

B.2. Optimal Hashing Techniques:
The other component of the project involves evaluating different hashing algorithms to determine the most effective approach for generating unique device fingerprints based on the component data of each entry. This involves:

- Algorithm Selection: Choosing various hashing algorithms (e.g., MD5, SHA-1, SHA-256) for evaluation.
- Data Analysis: Utilizing the components field in the dataset to generate hashes and assess their uniqueness and collision rates.
- Performance Comparison: Comparing the performance of each hashing algorithm in terms of speed, collision resistance, and the ability to produce unique fingerprints [12] [13].

C. Methodology
The following section includes the methodology of the two broad experiments that were conducted.
C.1. Device Platform Identification
In order to identify the device platform, we ran the processed data of the field operationOutput (CPU Timing Values) [5] for all entries which had run the operation exec step in order to ensure uniformity as the operation exec step was the most used operation. The experiment needed to be conducted two different approaches: once with all platforms included and once with just Windows and Mac (i.e., iPhone, iPad, and MacBook) platforms. We go into further detail on the causes of this.

C.1.1. Approach 1: Device Platform ID with Complete Data Set
- Data Cleaning: The data which included all platforms of the set, was cleaned to ensure accuracy and consistency.
2. Exploratory Data Analysis (EDA):
- Conducted EDA and discovered a significant imbalance in the data.
- Considered oversampling techniques to address class imbalances.
- Recognized that the numerical nature of the data complicates oversampling without a deeper understanding.
3. Feature Selection:
- Selected Operation Output as the feature then calculate statistical values as additional features.
- Perform a Correlation Matrix, SelectKBest [14], and Recursive Feature Elimination (RFE) [15] to reduce features.
- Chose Platform as the target variable.
4. Data Preprocessing:
- Analyzed five statistical categories: minimum, median, maximum, standard deviation, and mean.
- These categories provided five distinct values for training the model.
- Reserved 10 external datasets for validation, chosen at random.
5. Data Splitting: Split the dataset into 80% for training and 20% for testing.
6. Model Training:
- Implemented the following models: — K-Nearest Neighbors (KNN) — XGBoost — Random Forest (RF)
7. Primitive Analysis of Results:
- The models yielded unsatisfactory results.
- Identified several reasons for poor performance: — Data imbalance — Lack of discernible patterns — Overall limited dataset

C.1.2. Approach 2: Device Platform ID Experiment with Select Platforms
- Data Filtering:
- Filtered out all Linux platform values due to their extremely low representation and high degree of variation in Linux sub-classes.
- Combined iPhone, iPad, and MacIntel data under the Mac category, based on their similar underlying architecture.
2. Data Transformation: Transformed the dataset according to the aforementioned filtering and combination.
3. Reapplication of Approach 1 Steps: Performed the same steps as in Approach 1, including data cleaning, exploratory data analysis (EDA), feature selection, data pre-processing, data splitting, and model training.
4. Primitive Analysis of Results:
- Achieved better results compared to Approach 1.
- The model was able to learn patterns better when fed with just Mac and Windows data with a high training accuracy of around 75% and test accuracy close to 50%.

C.2. Optimal Hashing Techniques
To evaluate the effectiveness of different hashing algorithms for generating unique device fingerprints, we implemented a systematic approach that includes the following steps:
- Dataset Preparation: Cleaning and formatting the data to ensure consistency and accuracy in hash generation.
2. Hash Generation:
- The hash generation process was implemented using the hashlib library. The script processes the dataset and computes hashes for each entry by multiplying the current value with its weight and computing using the specified algorithm.
3. Performance Metrics: We evaluate the generated hashes based on several metrics:
- Collision Rate: This metric measures the proportion of duplicate hashes within the dataset. A lower collision rate indicates a better hashing algorithm.
- Uniqueness Ratio: The uniqueness ratio is the ratio of unique hashes to the total number of entries. Higher values suggest that the algorithm produces more distinct hashes.
- Hamming Distance: To assess the distinctiveness of the hashes, we compute the Hamming distance between pairs of hashes. The Hamming distance measures the number of differing bits between two hash values [16]. We calculate the average and standard deviation of Hamming distances across a sample of hashes to understand the variability and distinctiveness.
- Hash Generation Speed: The time taken to generate hashes for the entire dataset using each algorithm is recorded. This metric helps in understanding the computational efficiency of the algorithms.
4. Data Analysis and Visualization: The results were analysed, including collision rates, uniqueness ratios, Hamming distances, and hash generation speeds, and used to visualize the distribution and distinctiveness of the results.
D. Performance Evaluation
The following section includes the performance evaluations from the two broad experiments that were conducted.
D.1. Device Platform Identification


Analysis:
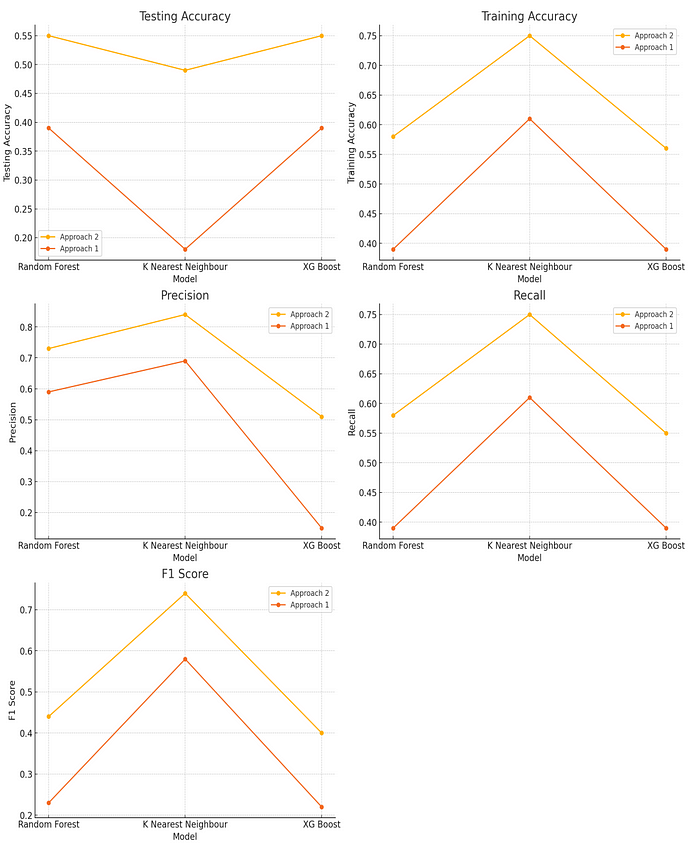
- Testing Accuracy: Approach 1: The testing accuracy for Random Forest, K Nearest Neighbour (KNN), and XGBoost is relatively low, with values of 0.39, 0.18, and 0.39 respectively. Approach 2: The testing accuracy improves for all models, with Random Forest and XGBoost achieving 0.55, and KNN achieving 0.49. This indicates that the changes made in Approach 2, such as removing Linux platform values and combining iPhone, iPad, and MacIntel data, had a positive impact on testing accuracy.
- Training Accuracy: Approach 1: The training accuracy for Random Forest, KNN, and XGBoost is 0.39, 0.61, and 0.39 respectively, showing moderate to high performance in training but not reflected in testing accuracy. Approach 2: Training accuracy is 0.58 for Random Forest, 0.75 for KNN, and 0.56 for XGBoost, indicating an overall improvement in the models’ ability to learn from the training data. KNN shows the highest training accuracy in both approaches.
- Precision: Approach 1: Precision values for Random Forest, KNN, and XGBoost are 0.59, 0.69, and 0.15 respectively, showing that KNN performs better in terms of precision. Approach 2: Precision improves for Random Forest (0.73) and KNN (0.84), while XGBoost shows a significant increase to 0.51. This suggests that Approach 2 enhancements resulted in a more precise classification.
- Recall: Approach 1: Recall values are 0.39 for Random Forest, 0.61 for KNN, and 0.39 for XGBoost. Approach 2: Recall improves to 0.58 for Random Forest and 0.75 for KNN, with XGBoost showing a slight improvement to 0.55. This indicates a better balance in identifying true positives across classes in Approach 2.
- F1 Score: Approach 1: F1 Scores for Random Forest, KNN, and XGBoost are 0.23, 0.58, and 0.22 respectively. Approach 2: F1 Scores improve to 0.44 for Random Forest, 0.74 for KNN, and 0.40 for XGBoost, highlighting an overall improvement in the harmonic mean of precision and recall.
- Feature Analysis: After creating a correlation matrix, we found that the mean and median were highly correlated, so we removed the median. Then we used SelectKBest to figure out the importance of each feature [14]. This approach pointed out the importance of the standard deviation and minimum features having the highest scores. Finally, using Recursive Feature Elimination (RFE) [15], we were able to confirm that the standard deviation, mean, and minimum statistical values were the features that we should be using. Despite these efforts, the feature selection process did not result in any significant improvement in our predictions.

Conclusion:
The analysis of the two approaches shows significant improvements in model performance metrics when transitioning from Approach 1 to Approach 2. Specifically:
- Data Transformation: The removal of Linux platform values and the consolidation of iPhone, iPad, and MacIntel data into a single category improved the balance and representation of the data.
- Model Performance: All models showed better testing accuracy, precision, recall, and F1 scores in Approach 2. This indicates that the changes made helped in reducing the impact of imbalanced and sparse data.
- Approach Effectiveness: The substantial improvements in the metrics suggest that Approach 2 is more effective for this dataset. However, the maximum test accuracy achieved (59%) indicates room for further improvements.

D.2. Optimal Hashing Techniques
To evaluate the effectiveness of different hashing algorithms for generating unique device fingerprints, we implemented a systematic approach that includes the following steps:

Analysis and Conclusion:
- All algorithms show a collision rate of 0 and a uniqueness ratio of 1. This indicates that each algorithm generates completely unique hashes for the given dataset of 54028 entries. The collision rate being zero is expected for well-designed cryptographic hash functions when the number of entries is relatively small compared to the hash space. Each hashing algorithm successfully avoided collisions, ensuring data integrity and uniqueness.
- None of the algorithms have any missing hashes, signifying that all entries were processed and hashed correctly without any loss of data.
- SHA-512 and BLAKE2b have the highest average Hamming distances (119.9983 and 120.0027 respectively), suggesting they are better at discriminating between different entries.
- MD5 has the lowest average Hamming distance (30.0015), indicating it might not be as effective in differentiating between entries as the other algorithms.
- SHA-1 and MD5 have relatively lower compute times compared to the other algorithms. While MD5 is known for being fast but less secure, SHA-1’s compute time (449.7988 seconds) is lower than that of SHA-224, SHA-256, and SHA-512, which could impact performance.
- Based on this analysis, SHA-512 and BLAKE2b appear to be the best algorithms for generating unique device fingerprints due to their high average Hamming distances and low collision rates. However, their higher compute times need consideration in a practical scenario. MD5, although the fastest, is less secure and less effective in terms of average Hamming distance


E. Conclusion
The comparative analysis for enhancing device fingerprinting using CPU timing values demonstrated significant improvements with Approach 2 over Approach 1. Approach 2 involved filtering out low-representation Linux platform values and consolidating iPhone, iPad, and MacIntel data into a single category, which improved the balance and representation of the dataset. This led to better model performance across all metrics, including testing accuracy, precision, recall, and F1 scores. Among the models used, K-Nearest Neighbors (KNN) showed the highest training accuracy, while Random Forest and XGBoost achieved the highest testing accuracy. These models can effectively detect the platform from the CPU timing values, although further refinements are necessary as the maximum test accuracy achieved was 59%.
The optimal hashing techniques experiment revealed that algorithms like SHA-512 and BLAKE2b are more effective in generating unique device fingerprints due to their high average Hamming distances and low collision rates. These findings can be applied in real-world scenarios such as enhancing cybersecurity measures, personalizing user experiences, and preventing fraud in online transactions by reliably identifying devices based on their unique fingerprints. The research underlines the potential of machine learning models and optimal hashing techniques for robust device fingerprinting, contributing valuable insights into cybersecurity and user identification.
F. Future Work
- Advanced Data Preprocessing: Implement more sophisticated techniques for handling imbalanced data, such as SMOTE (Synthetic Minority Over-sampling Technique) [17] or class weight adjustments, to improve model robustness and performance.
- Feature Engineering: Investigate additional features or transformations that can capture more nuanced patterns in the data, potentially enhancing the models’ predictive capabilities.
- Hyperparameter Tuning: Conduct extensive hyperparameter tuning for each machine learning model to optimize their performance and identify the most effective configurations.
- Incorporating Additional Data: Gather more comprehensive data to better understand the correlation between features and target variables, which may lead to improved model accuracy and reliability.
- Exploration of Alternative Models: Explore and compare other machine learning algorithms, such as neural networks or ensemble methods, to determine if they offer superior performance for the task of device fingerprinting.
Contributions & Acknowledgements
CipherPrint was developed as part of the Network Architecture course by Aunsh Bandivadekar, Dillon Jackson and Connor Ye in the spring of ’24 at the Department of Electrical and Computer Engineering @ UC Davis.
Check out the code for the project on Github.
Furthermore, the authors would like to express their gratitude to all the individuals that supported this project. We would like to thank Hari Venugopalan (PhD.) and Ryan Swift (BS.) for providing the data set and insights in the project. Furthermore, we thank Saisha Shetty (MS.) for her guidance in incorporating ML methodologies. Lastly, we thank Dr. Chen-Nee Chuah for her invaluable support.
References
[1] T. Kohno, A. Broido, and K.C. Claffy. “Remote physical device fingerprinting”. In: IEEE Transactions on Dependable and Secure Computing 2.2 (2005), pp. 93–108. doi: 10.1109/TDSC.2005.26.
[2] Jinho Song, ChaeHo Cho, and Yoojae Won. “Analysis of Operating System Identification via Fingerprinting and Machine Learning”. In: Computers & Electrical Engineering 78 (2019), pp. 1–10. issn: 0045–7906. doi: 10.1016/j.compeleceng.2019.06.012. url: https://www.sciencedirect.com/science/article/pii/ S0045790618324765.
[3] Iskander Sanchez-Rola, Igor Santos, and Davide Balzarotti. “Clock Around the Clock: Time-Based Device Fingerprinting”. In: Oct. 2018, pp. 1502–1514. doi: 10.1145/3243734.3243796.
[4] Qiang Xu et al. “Device Fingerprinting in Wireless Networks: Challenges and Opportunities”. In: IEEE Communications Surveys Tutorials 18.1 (2016), pp. 94–104. doi: 10.1109/COMST.2015.2476338.
[5] R. Swift H. Venugopalan. HASHED combined data upto oct 31 2023. University of California, Davis. Device Fingerprinting Data Set.
[6] GeeksforGeeks. Feature Selection Techniques in Machine Learning. Accessed: 2024–06–09. 2024. url: https: //www.geeksforgeeks.org/feature-selection-techniques-in-machine-learning/.
[7] Tin Kam Ho. “Random decision forests”. In: Proceedings of 3rd international conference on document analysis and recognition. Vol. 1. 1995, pp. 278–282.
[8] N. Ali, D. Neagu, and P. Trundle. “Evaluation of k-nearest neighbour classifier performance for heterogeneous data sets”. In: SN Applied Sciences 1.12 (2019), p. 1559. doi: 10.1007/s42452- 019- 1356- 9. url: https: //doi.org/10.1007/s42452–019–1356–9.
[9] XGBoost Contributors. XGBoost Documentation. Accessed: 2024–06–04. 2023. url: https://xgboost.readthedocs. io/en/stable/.
[10] A. Bajaj. Performance metrics in machine learning [complete guide]. neptune.ai. Accessed Jun. 3, 2024. url: https://neptune.ai/blog/performance-metrics-in-machine-learning-complete-guide.
[11] A. S. M. Shafi et al. “Detection of colon cancer based on microarray dataset using machine learning as a feature selection and classification techniques”. In: SN Applied Sciences 2 (July 2020). doi: 10.1007/s42452–020- 3051–2.
[12] N. Tiwari. All about hamming distance algorithm. https://www.analyticsvidhya.com/blog/2024/03/allabout-hamming-distance-algorithm/. Accessed: 2024–06–04.
[13] Which hashing algorithm is best for uniqueness and speed? Software Engineering Stack Exchange. Accessed: 2024–06–04. url: https://softwareengineering.stackexchange.com/questions/49550/which-hashingalgorithm-is-best-for-uniqueness-and-speed.
[14] J. Brownlee. How to Choose a Feature Selection Method for Machine Learning. Accessed: 2024–06–09. 2024. url: https://machinelearningmastery.com/feature-selection-with-real-and-categorical-data/.
[15] RFE. Accessed: 2024–06–09. 2024. url: https://scikit-learn.org/stable/modules/generated/sklearn. feature_selection.RFE.html.
[16] David J. C. MacKay. Information Theory, Inference, and Learning Algorithms. Cambridge: Cambridge University Press, 2003. isbn: 0–521–64298–1.
[17] Nitesh V. Chawla et al. “SMOTE: Synthetic Minority Over-sampling Technique”. In: Journal of Artificial Intelligence Research 16 (2002), pp. 321–357.